Setting TRIOS Options
Selecting Your User Settings
There are two groups of settings that can be customized—Results Document Settings and Units Settings. Results documents are essentially data files created as a result of experiments performed on the instrument. Use Units Settings to modify the units of measurement universally. Follow the instructions below to set up your system.
- NOTE: The TRIOS software Application options are global settings applicable to the computer where the program is installed. Therefore, if you open more than one copy of the program, these settings are shared.
To Customize Results Document Settings
- Click the TRIOS button
 .
.
- Click Options
 from the bottom of the window.
- Select User from the left-hand panel, if necessary. The Initial settings for the TRIOS application window displays.
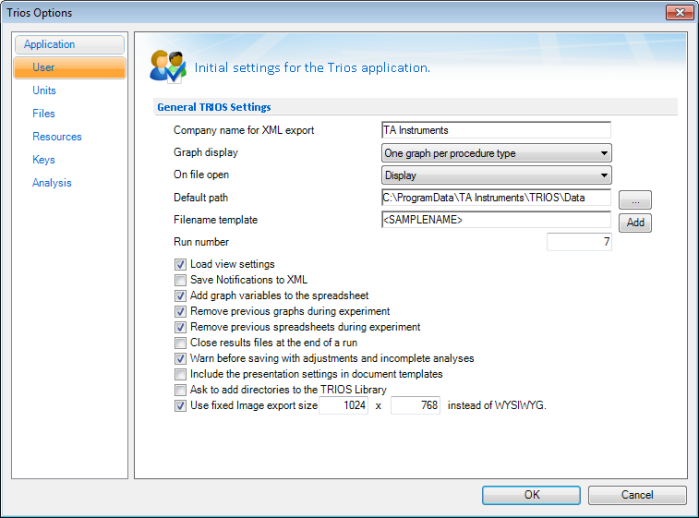
- Select the desired On file open behavior. You can choose None for no action, or Display to automatically display the opened data file.
- Enter or choose the desired Default path to set up the file folder where your TRIOS documents will be saved.
- Set up the desired Filename template (or format) that will be used when a filename is created and saved. The template is made up of one or more bracketed parameters (e.g., the default is <SAMPLENAME>_#<RUNNUMBER>), called tokens, which can be strung together in any order. A token can also contain text between the brackets.
- Place the cursor in the Filename template field where you want to add a token or enter your own text. (You can also delete the default template and start fresh, if desired.)
- Click Add. The Insert Template Token window displays.
- Select the token and click Insert.
- NOTE: You can define the filename template for an individual experiment, which will override the settings you choose here.
- NOTE: If you change these global file settings, the new settings are applied to future experiments. However, the displayed file name shown on the experiment page for any currently configured experiment is not updated. Any new experiment reflects the filename setting changes.
- Enter the Run number that you wish to use as the initial number for your experiments (for example, 1 or 01 or 001).
- Check Load view settings if you want to restore the presentation and variable settings for the graphs and spreadsheets from your results files.
Leave Load view settings blank to use the current presentation and variable settings instead and ignore the view settings specific to that file.
- Notifications messages are saved daily in a TRIOS format. Enable Save Notifications to XML to also save the notifications messages to XML format.
- Check Add graph variables to the spreadsheet for TRIOS to automatically add the variables.
- Select a Graph display during experiment option.
- One graph only – Displays all steps on a single step overlay view.
- One graph per step – Each step displays its own individual graph view.
- One graph per procedure type – Each procedure (oscillation, flow, etc.) displays its own individual graph view.
- One graph per step type – Each step (oscillation time, oscillation frequency, etc.) displays its own individual graph view.
- Select Remove previous graphs during experiment if you wish to remove previously-generated graphs once a new graph is generated.
- Select Remove previous spreadsheet during experiment if you wish to remove previously-generated spreadsheets once a new graph is generated.
- Check Close results files at the end of a run if you do not want TRIOS to display results after a run.
- When a results file is saved, any active adjustments (Shift/Rotate/Smooth) or any analyses that have been started but not accepted are not saved to the file. If Warn before saving with adjustments and incomplete analyses is checked, then a warning message displays before the file is saved. The message box gives the option to continue with or without saving, and includes the option to not show the message again. By default, the message box displays in order to inform you that there are unsaved changes.
- Check Include the presentation settings in document templates to have your saved presentation settings included on all document templates.
- Check Ask to add directories to the TRIOS Library to be prompted to add directories to TRIOS Library.
- Check Use fixed Image export size ________ x _______ instead of WYSIWYG to set all images that you export from TRIOS to the size that you specify here.
- NOTE: The default image export size is 1024 x 768; the default size also applies to copying and pasting.
- Click OK when finished.
Back to top
Setting Your Units Defaults
- Click the TRIOS button .
- Click Options from the bottom of the window.
- Select Units from the left-hand panel. The Units settings for the TRIOS documents window displays.
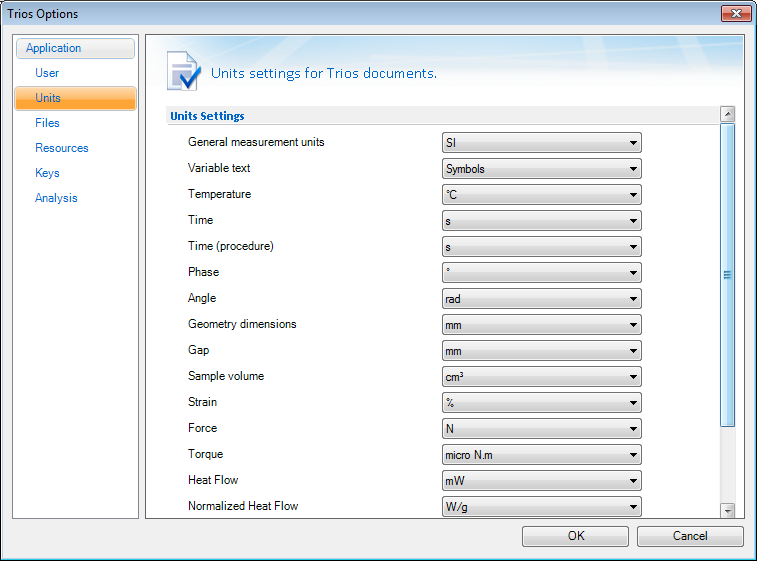
- Make the necessary updates as needed. The selections will be used when procedures and data are displayed in TRIOS.
- Click OK when finished.
Back to top
Viewing the Application Files
- Click the TRIOS button .
- Click Options from the bottom of the window.
- Select Files from the left-hand panel, if needed. The Version information for the TRIOS application files window displays.
- NOTE: This window is view-only.
Back to top
Accessing TRIOS Resources
- Click the TRIOS button .
- Click Options from the bottom of the window.
- Click Resources from the left-hand panel.
- In the Get Updates section of the window, click Check for Updates to check for the latest TRIOS updates, available on the TA Instruments' web site.
- In the Contact Us section of the window, click Contact Us to access the Software Tracking System. Use this system to submit to TA Instruments any problems you may be having with TRIOS.
- In the Go to TA Instruments Online section of the window, click Get Online to access TA Instruments' main Thermal Analysis and Rheometer web site.
- In the Support Online section of the window, click Get Videos to access support videos online.
- In the About TRIOS section of the window, click About to access the About box, which details the version of TRIOS currently running. The About information displays the main TRIOS package version of the software. Click Files on the left-hand panel for detailed information on the individual components.
Back to top
Displaying and Installing Keyed Options
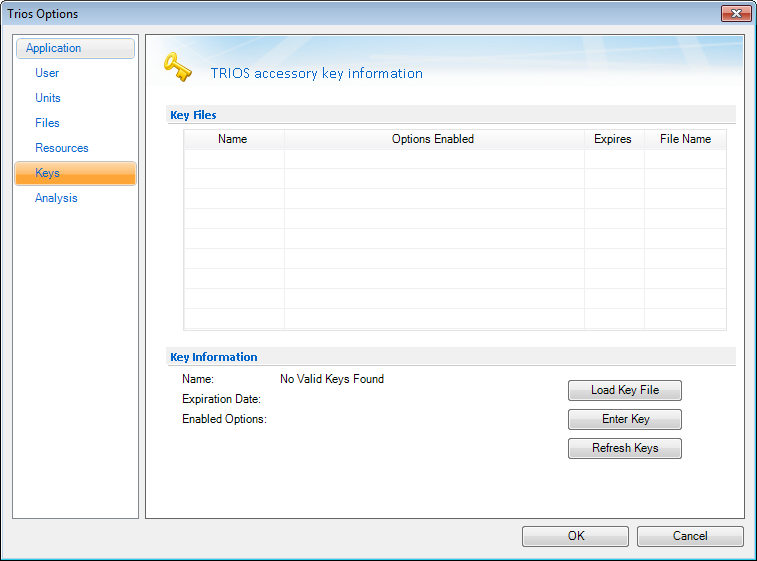
Within TRIOS software, there are some optional (keyed) functionality available. To enable or view these options, click the TRIOS button , select Options, and select Keys from the left-hand panel. The screen below displays.
Read the sections below for additional information on using keyed options.
Viewing Keyed Options
- Click the TRIOS button at the upper-left corner of the application.
- Click Options from the bottom of the window.
- Select Keys from the left-hand panel.
- The installed keyed options are displayed in the Key Files table.
Installing Keyed Options
To install your TRIOS keyed options, follow the instructions below:
- Click the TRIOS button at the upper-left corner of the application.
- Click Options from the bottom of the window.
- Select Keys from the left-hand panel. Keys may be installed by manually entering key parameters, or by loading a key file.
- To enter a key file manually:
- Click Enter Key. The window below displays.
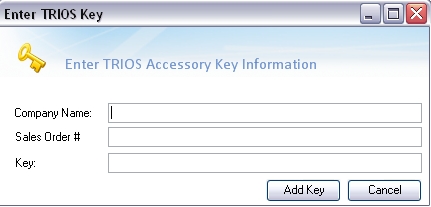
- Enter the information exactly as it appears on the TRIOS Accessory Key Information document, then click Add Key. Note that dashes and capitalization are not necessary when entering the key.
- If entered successfully, the key installs and displays in the Key Files table.
- To load a key file:
- Click Load Key File.
- Browse to and select the file, then click Open.
- If loaded successfully, the key displays in the Key Files table.
Back to top
Setting Analysis Options
Within TRIOS software, there are several algorithm options available for smoothing signals, including derivative signals (which often exhibit short-term noise) and reduction techniques. To select the desired method:
- Click the TRIOS button .
- Click Options from the bottom of the window.
- Select Analysis from the left-hand panel. The screen below displays.
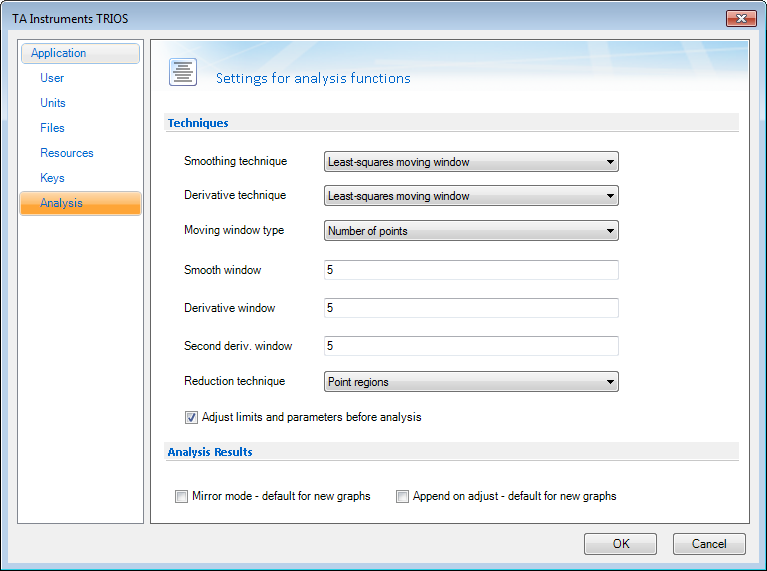
- Select the Smoothing options:
- Polynomial: The polynomial model uses a three term polynomial to fit the data in a running window and evaluates the center point.
- FFT: The FFT model transforms the data into a spectrum, removes the upper frequency contributions, and converts the spectrum back. The window size defines the cut-off frequency in the spectrum.
- Least-squares moving average: The smoothing option allows you to smooth curves using a least-squares averaging technique. Normal curves are smoothed versus the X-axis signal, and derivative curves are smoothed versus the X-axis signal with respect to which the derivative was taken. Integral curves cannot be smoothed. [This is the technique used in Universal Analysis.]
- NOTE: It is recommended that you perform smoothing prior to any analysis functions.
- Select the Derivative options:
- Central difference: The derivative is calculated using a simple central different formula:
f’(xn) =(f(xn-1) + f(xn + 1)) / (xn+1 – xn-1)
For second derivatives, the calculation is performed twice, once to obtain the derivative and again to obtain the second derivative.
Note that when Central difference is selected, the derivative window (see below) has no effect.
- Cubic spline: The derivative is calculated using a clamped cubic spline technique. Note that when cubic spline is selected, the derivative window (see below) has no effect.
- Least-squares moving window: The derivative is calculated using a moving window with straight-line least-squares fitting. This is the factory default setting for calculating derivatives.
For second derivatives, the calculation is performed twice, once to obtain the derivative and again to obtain the second derivative.
The window size may be adjusted by setting the derivative window % and second derivative window % values (see below).
- Derivative window % and Second derivative window %: The window size (1 – 100%) used in calculating the derivative. Note that the derivative window applies only when the derivative technique selected is Least-squares moving window (see above).
Technical note: The scale 1 – 100 is presented for ease-of-use. The actual % of the curve considered ranges from 0.1 to 20.0 exponentially.
- Select Moving window type
The Moving window type allows you to move a window of a certain width across data, fitting straight lines through the window to find a suitable value for a central point of the window. Make one of the following selections for determining the width of the window:
- NOTE: This option is applicable to all techniques for smoothing calculations and the least-squares moving window technique only for derivative calculations.
- Percentage of curve: Select the width of the moving window by setting a percentage of the curve.
- Number of points: Select the width of the moving window by setting a fixed number of points.
- Select the Reduction options:
- Point regions: The points in the step are considered in their current order and divided into n regions (where n is the number of points to reduce to). The middle point of each region is selected to represent the region and the rest discarded.
- Equal x spacing: The points in the step are considered in sorted x-axis order. Regions are then considered where each region is (xmax – xmin) / n wide in x (where n is the number of points to reduce to). The point nearest in x to the middle of reach region is selected to represent the region and the rest are discarded.
- Equal curve path spacing: The points in the step are considered in sorted x-axis order and the total xy curve path length is calculated. Regions are then considered where each region is CurveLength / n wide in distance along the xy curve (where n is the number of points to reduce to). The point nearest in distance along the xy curve is selected to represent the region and the rest discarded. This option is useful when data includes sharp vertical peaks and it is desirable to retain proportionally more points in the peak than would be the case with the first two options.
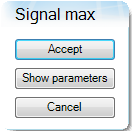
- Adjust limits and parameters before analysis: Select this option to enable the mini analysis dialog box (see below), which displays when selecting Analysis from the right-click menu. The mini dialog box allows you to adjust limits and parameters prior to performing the analysis.
- NOTE: This option is enabled by default for Thermal users and disabled by default for Rheology users.
Back to top
